
How to View MongoDB Collections as Diagrams

MongoDB doesn’t need a big introduction. It’s one of the fastest-growing databases in the market, and for a good reason. MongoDB has a unique approach to working with data by focusing on flexibility.

Offering Flexibility

Compared to a relational database like MySQL that uses well-defined tables to store data, MongoDB offers more flexibility by storing the data in JSON-like objects. The objects are then stored in collections. Two objects from the same collection can have different data-fields. For example, we can have the next two objects in the same collection:

SQL


1
{
2
id: “1”
3
name: ”John”
4
age: “43”
5
department: “Sales”
6
}
7
8
{
9
id: “12”
10
name: “Susan”
11
email: “susan@example.com
12
Status: “A”
13
}


As we can see, even though the objects are in the same collection, they can contain different data fields. This is the flexibility that MongoDB offers when working with data. 

The Schema Problem

This type of storing the data comes at the cost of not having a schema. MongoDB is focusing more on storing everything in documents instead of tables making it easier to scale the database. 

Even so, it is possible to visualize your MongoDB collections and objects as a schema. The solution comes from DbSchema.

Deducing a Virtual Schema

DbSchema can connect to MongoDB, look in the sample collection records, and deduce a virtual diagram from there. 

All you have to do is to connect to MongoDB and the tool will deduce the schema automatically. 

DbSchema

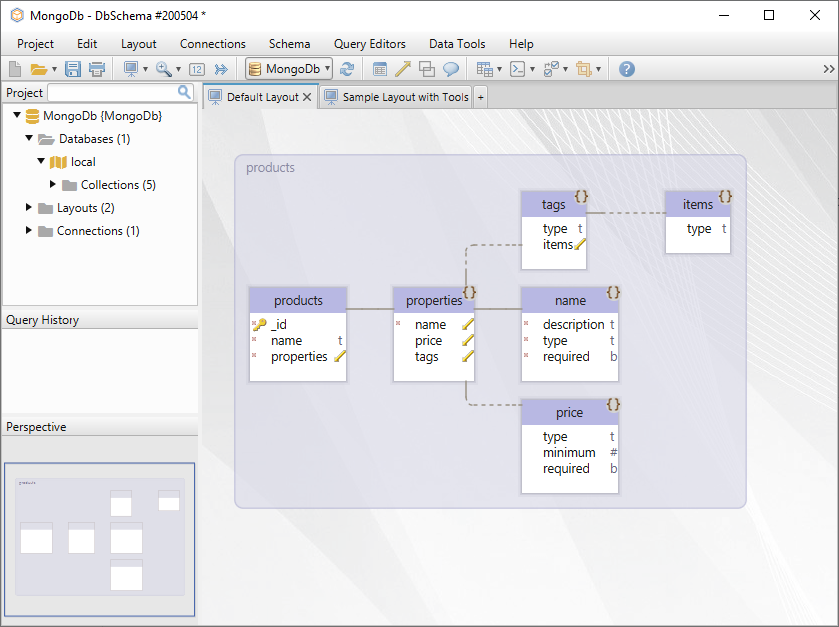
Once the diagram is deduced, the possibilities are endless. The diagram is interactive so you can modify the objects without having to write any query. 

You can split the database in multiple layouts, each focused on a specific part of the database. For example, you can create a layout for the “quiz” collection and another one for the “user” collection. 

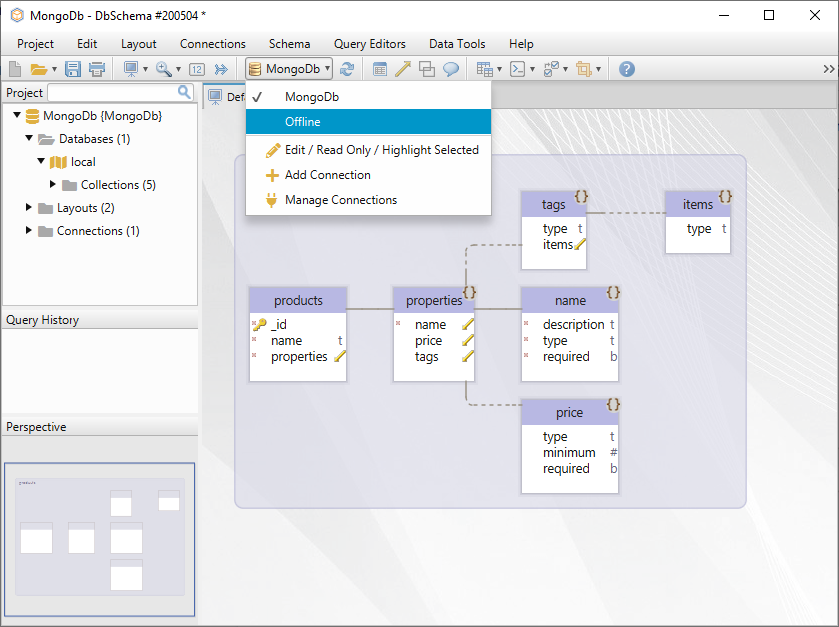
Working Offline and Synchronizing

DbSchema stores the schema information in local project files. This enables you to work on the “schema” without database connection and synchronize it later.

It is also possible to compare and synchronize two different versions of the same project file, thus making it easy to work on the same project in a team. 

Working offline

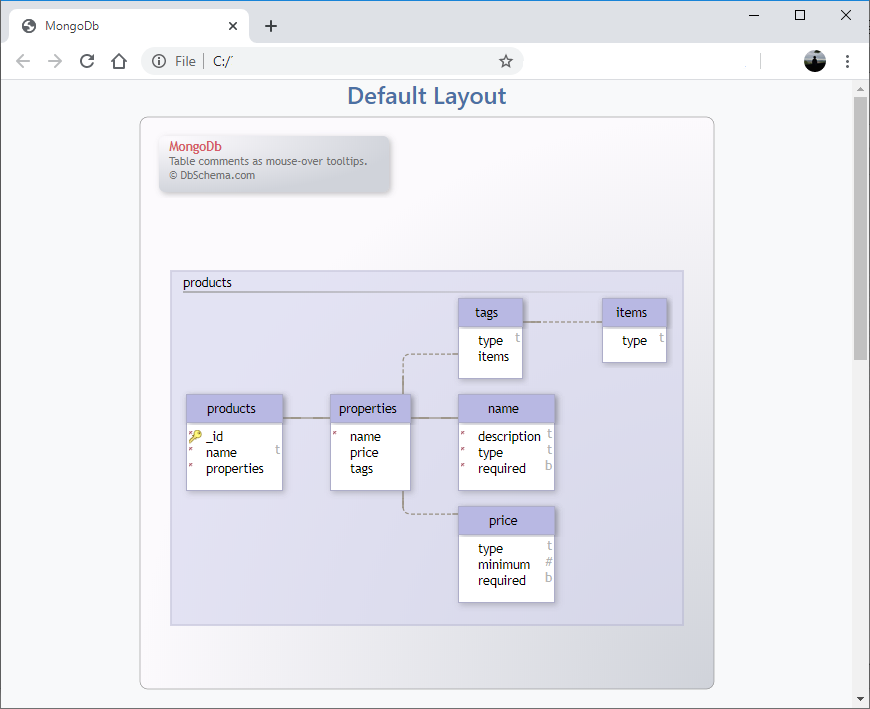
Documenting the Schema

Yes! You can also export the schema as an HTML5 or PDF documentation with comments and callouts.
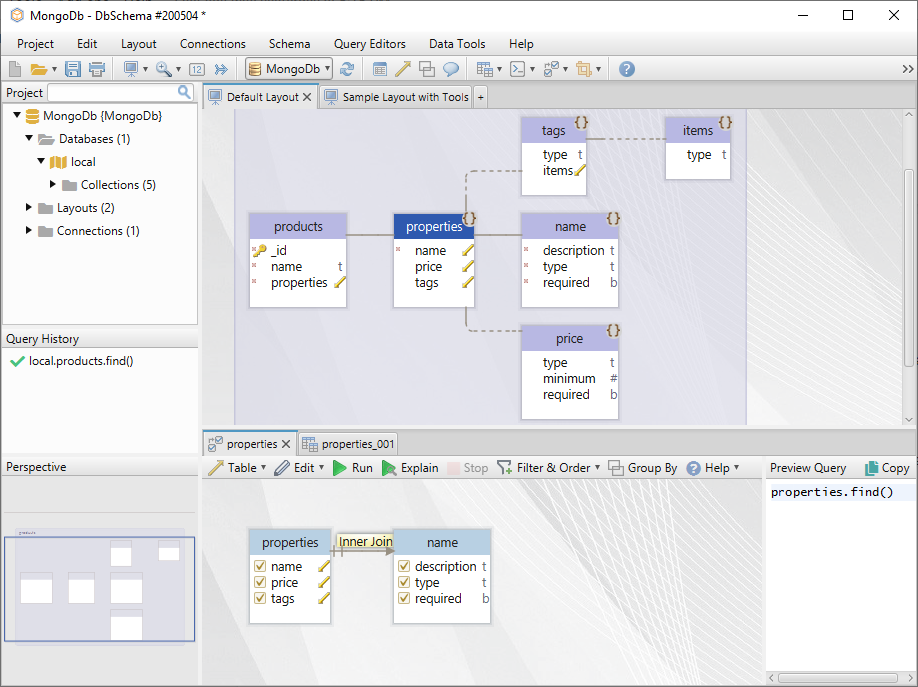

Query & Data Tools

DbSchema offers a set of awesome tools that you can use on MongoDB such as Relational Data Browse, Visual Query Builder, Random Data Generator, and more. 


Conclusion

Using DbSchema you can still visualize the objects and collections of your MongoDB as a diagram & interact with them. 

Comments

Popular posts from this blog

How to use Ngx-Charts in Angular ?

Charts helps us to visualize large amount of data in an easy to understand and interactive way. This helps businesses to grow more by taking important decisions from the data. For example, e-commerce can have charts or reports for product sales, with various categories like product type, year, etc. In angular, we have various charting libraries to create charts.  Ngx-charts  is one of them. Check out the list of  best angular chart libraries .  In this article, we will see data visualization with ngx-charts and how to use ngx-charts in angular application ? We will see, How to install ngx-charts in angular ? Create a vertical bar chart Create a pie chart, advanced pie chart and pie chart grid Introduction ngx-charts  is an open-source and declarative charting framework for angular2+. It is maintained by  Swimlane . It is using Angular to render and animate the SVG elements with all of its binding and speed goodness and uses d3 for the excellent math functions, scales, axis and shape ge

JavaScript new features in ES2019(ES10)

The 2019 edition of the ECMAScript specification has many new features. Among them, I will summarize the ones that seem most useful to me. First, you can run these examples in  node.js ≥12 . To Install Node.js 12 on Ubuntu-Debian-Mint you can do the following: $sudo apt update $sudo apt -y upgrade $sudo apt update $sudo apt -y install curl dirmngr apt-transport-https lsb-release ca-certificates $curl -sL https://deb.nodesource.com/setup_12.x | sudo -E bash - $sudo apt -y install nodejs Or, in  Chrome Version ≥72,  you can try those features in the developer console(Alt +j). Array.prototype.flat && Array.prototype. flatMap The  flat()  method creates a new array with all sub-array elements concatenated into it recursively up to the specified depth. let array1 = ['a','b', [1, 2, 3]]; let array2 = array1.flat(); //['a', 'b', 1, 2, 3] We should also note that the method excludes gaps or empty elements in the array: let array1

Understand Angular’s forRoot and forChild

  forRoot   /   forChild   is a pattern for singleton services that most of us know from routing. Routing is actually the main use case for it and as it is not commonly used outside of it, I wouldn’t be surprised if most Angular developers haven’t given it a second thought. However, as the official Angular documentation puts it: “Understanding how  forRoot()  works to make sure a service is a singleton will inform your development at a deeper level.” So let’s go. Providers & Injectors Angular comes with a dependency injection (DI) mechanism. When a component depends on a service, you don’t manually create an instance of the service. You  inject  the service and the dependency injection system takes care of providing an instance. import { Component, OnInit } from '@angular/core'; import { TestService } from 'src/app/services/test.service'; @Component({ selector: 'app-test', templateUrl: './test.component.html', styleUrls: ['./test.component