1: clear(), debug(), warn(), error()
You may probably know the methods. They will print passed string with the appropriate color
- console.clear(): Clears the logs in the console
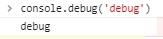
- console.debug(): Logs message to the web console at the "debug" log level. The message is only displayed to the user if the console is configured to display debug output
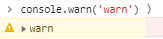
- console.warn(): Logs warning message to the console. By default the warning message will be highlighted with yellow color
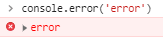
- console.error(): Logs error message to the console. Useful in testing code. By default, the error message will be highlighted with red color
2: console.assert()
console.assert() takes 2 arguments. If the first argument is falsy only then it displays the second argument. If the assertion is true, nothing happens. This method is useful in some cases where you may want to print something when a conditionally. Now you don't have to print logs by wrapping them in if-else :D
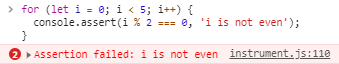
You can see that console message has been printed 2 times out of 4 iterations i.e. only when i is not even
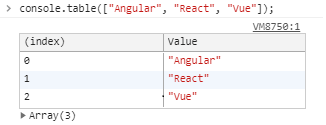
3: console.table()
Display an object or array in a very nice table view making it more readable
This function takes one mandatory argument data, which must be an array or an object, and one more optional parameter columns. Each element in the array or enumerable property if data is an object will be a row in the table. This makes it easier to see what you’re dealing with!
Display array
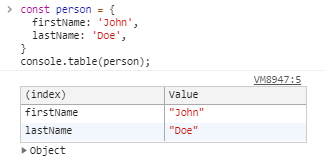
Display object
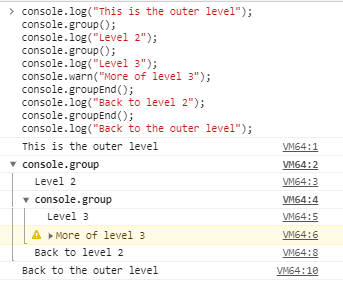
4: console.group() and console.groupCollapsed()
After writing so many logs, you might want to organize them. You can use nested groups to help organize your output by visually associating related messages. To create a new nested block, call console.group(). The console.groupCollapsed() method is similar, but the new block is collapsed and requires clicking a button to read it
This can also be used when you have a few log statements within a function and you want to be able to clearly see the scope corresponding to each statement
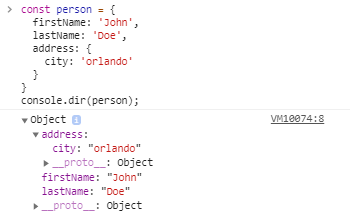
5: console.dir()
The console.dir() method prints an interactive list of object properties of a specified object while console.log() prints a toString representation of the object
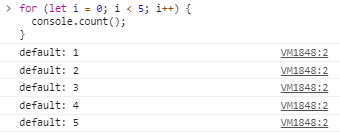
6: console.count()
It will take an optional label as an argument and every time it is called, it will increment the count by 1. If a label is provided, it will log the number of times console.count() has been called with the provided label else it will log the number of times console.count() has been called at that particular line. It can be used in a case of recurring function or code to keep count of how many times your code executed
7: console.time() with console.timeEnd()
These are useful in analyzing the performance of your code in execution time, Use console.time() by providing an argument before the code then use console.timeEnd() with the same console.timeEnd() to see the time it took to run the code
For example, Let's take a big sized array of 10000000 numbers and we will compare performances of basic for, for-of and for each loop. Let's find out which loop iterates the array fast
const longArray = Array.from({ length: 10000000 }, (_, i) => i);

// For-of loop
console.time();
for (const value of longArray) {
  // Doing nothing
}
console.timeEnd();

// Basic for loop
console.time();
for (let i = 0; i < longArray.length; i++) {
  // Doing nothing
}
console.timeEnd();

// forEach loop
console.time();
longArray.forEach(element => {
  // Doing nothing
});
console.timeEnd();
If you run the above code, you'll see an output similar to below output. We can see that basic for loop took the least time to iterate over our big sized array followed by forEach and for-of loop
default: 332.089ms  // For-of loop
default: 28.555ms   // Basic for loop
default: 357.879ms  // forEach loop
If you want to know why basic for loop is fast compared to others then that's a question for another day. So that's how console.time() with console.timeEnd() can be used to calculate elapsed time
8: console.trace()
Many times we want to get track of which function is called by which function. The console.trace() method will come to your rescue
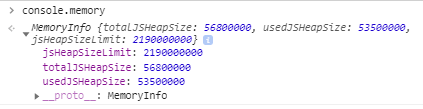
9: console.memory
If you are looking for a memory leak for finding the root cause of the performance issue, you might want to use the console.memory property to check out your heap size status
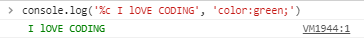
Bonus Tip (Add CSS to console messages)
We all get bored by looking at the same style of console log messages. There's a way to add CSS by which you make your logs look more appealing. Use the special %c character to add some custom CSS flavor to the console
console.log('%c LOG_MESSAGE', 'CSS')
Conclusion
We have discussed almost every cool JavaScript console method in the Console API and you now have a larger scope of the Console API methods. Using these methods can make your debugging a bit more productive
If you enjoyed the blog post, Share it on social media. If you want get notified when new post is out, subscribe to push notifications by Signing in
If you have any questions, suggestions or feedback, Please leave them in the comments below!
Related posts
- Get link
- X
- Other Apps
- Get link
- X
- Other Apps
Comments
Post a Comment